How To Beat Warren Buffett
It’s dangerous territory to compare yourself to “the best” in anything. But it sure makes a great benchmark. Warren Buffett is arguably one of the best investors to walk the planet, amassing wealth to rank him one of the wealthiest people in the world. So let’s start there.
Losers
First we’ll look at the downside of Buffett’s track record, the losses. Since 1990 (25 years) 39% of the time he loses money in a month. When his stock is down, how far done does it go? The average down month is -4%, and the worst month was -14%. Looking back, there’s been 2 times that he’s had to suffer through losses of 50% (2001, and 2008). (Could you image being down $40 billion?!) So even the “best investor” has certainly had his down times.
Digging deeper we find that when there’s a losing month, 56 times it’s just a single down month-in-a-row, but he’s suffered through 5 consecutive losing months twice, and even had a really bad streak of 7 losing months-in-a-row at one point (in 2004).
Losing Month Comparison
How does our Global Asset Momentum strategy compare? It’s experiences a losing month 32% of the time (vs 39%). When it goes down, the average loss is -3% (vs -4%), and it’s worst month is -13% (vs -14%). So our strategy has been slightly better in each category. But there’s one very big improvement: the maximum loss has only been -22% which is significantly easier to handle than Buffett’s 50% losses twice. I think it’s fair to say that our strategy has done a better job of experiencing less losses, and far less dramatic losses than Buffett.
Growth
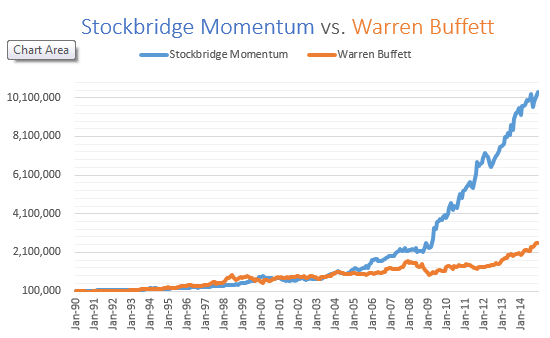
But losses are just one side of the coin. The bottom line is “who’s grown more?” In the last 25 years, Buffett has outpaced the stock market, earning a compound annual return of 14%. $100,000 invested with Buffet (re-investing dividends) grows to a healthy $2.6 million in 25 years.
The Stockbridge Momentum Strategy beats Buffett.
It’s averaged 20% per year since 1990, and the same $100,000 invested grows to an astonishing $10.4 million. Now we can see the impact of earning just a few percentage points more per year, and doing just a little bit better job of minimizing risk. It’s literally a 400% difference over 25 years.
Here’s the data tables:
| %losing months | avg loss | worst month | MDD | |
| Stockbridge Momentum | 32% | -3% | -13% | -22% |
| Berkshire | 39% | -4% | -14% | -44% |
| %up months | avg gain | best month | Growth | |
| Stockbridge Momentum | 68% | 4% | 21% | 20% |
| Berkshire | 59% | 4% | 30% | 14% |
Source: Yahoo Finance
Eric Ludwig is a certified financial planner in Madison, WI primarily for a select group of successful professionals and business owners, who among other things aspire to a work-optional lifestyle. Stockbridge has developed and refined a process to put all the pieces of that puzzle together and we call it the Stockbridge GPS process. GPS stands for Goals, Planning, Strategy.

