• Skip to primary navigation
  • Skip to main content
  • Skip to primary sidebar
  • Skip to footer
Stockbridge Private Wealth Management

Stockbridge Private Wealth Management

Personalized Financial Strategies for a Secure Retirement

  • Home
  • About
    • About Us
    • Why Hire Us
    • Contact Us
  • Services
    • Investment Management
    • Retirement Planning
    • Retirement Income
    • Tax Planning
    • Social Security Timing
    • Insurance Optimization
  • Contact Us
  • Schwab Account Login

Momentum

Do you have an investment strategy or are you gambling?

December 11, 2015 By Eric Ludwig

Do you have an investment strategy, or are you gambling?

Recently, somebody asked for my opinion of a certain stock they were considering buying.  I never know quite how to answer that question because buying individual stocks isn’t part of the investment strategies we run.  For 1, I’m not a big fan of owning individual stocks because I’d much rather own a commission-free, low-cost ETF that consists of 1,000 companies instead of buying only 1 company.  And 2, it probably doesn’t matter so much as “what stock to buy” as much as it does to be able to answer “when should I buy it” and “when should I sell it.”

The reason this question irks me so much though, is because it gets at the root of most investors problem: they’re gambling, not investing.  How do you know if you’re a gambler or an investor?  The ex-airline pilot in me has created a checklist to find out.  If you answer “no” to any of the questions, you’re probably just gambling with your money.  Or even worse, if you use the services of an investment advisor and they answer “no” to any of the questions, you’re paying someone else to gamble with your money…not cool dude!

First, the nuts and bolts of what makes it an actual strategy:

  1. My investing decisions can be boiled down to rules that could be programmed into a computer and answer the following:
    1. what to buy
    2. when to buy it
    3. how much to buy
    4. what to sell
    5. when to sell it
    6. how much to sell

Now you see why asking me “what do you think of this stock” just seems odd to me.  If it fits your investment strategy’s rules, buy the stock; if not, don’t buy it.  It’s pretty linear thinking at this level.  The idea of some stock jockey sitting in front of 15 computer screens watching their indicators with beads of sweat dripping down their forehead is Hollywood my friend, not Wall Street.  Investing, pragmatic investing, is pretty damn boring.  You run your system, you follow the rules, you go on about your day.  Once the rules are developed, it’s all about the proper execution of the strategy and just following the rules.  Think about weight loss for example.  You eat healthy, eat less, you exercise.  You just follow the steps and the results will happen.  That’s why it’s so important to focus on “process”, not “outcome.”  You can’t change the outcome.  That just happens.  But we can change our process.  And a better process will eventually lead to better results.

The next part of the checklist will determine if the strategy will actually make money or not. For example, I could come up with a “strategy” that buys all stocks that start with the letter A, every January, with 100% of my account value, and then sell them in December and repeat with the letter B next January.  That fits all the criteria to make it a “strategy”, but now we need to address whether or not it will make money.  And last time I checked that is the point of investing, right.  We need to be able to answer ‘yes’ to these questions:

  1. My investment strategy is based on a market truth of how the market really works (ex. momentum, short-term mean-reversion, trend-following, etc.  Not “buy in May and go away”.)
  2. My investment strategy has a repeatable edge that is not sensitive to input metrics, as determined by robust back-testing results (okay, that was the nerdiest thing I wrote today, but it’s very important. Many back-tested systems work because someone tried 487 combination of inputs until they finally got 1 that showed it would generate $200 million in 5 years.  If you roll the dice long enough, you’ll eventually roll a pair of snake-eyes 10 times in a row.  But we want positive results that work under all market conditions.  That’s what I mean by being robust, and not chance.)
  3. I can calculate the expected return, maximum equity drawdown, and probability of a positive and negative year (again, the only way to know this is because you can back-test a set of rules that you created in step 1 above)
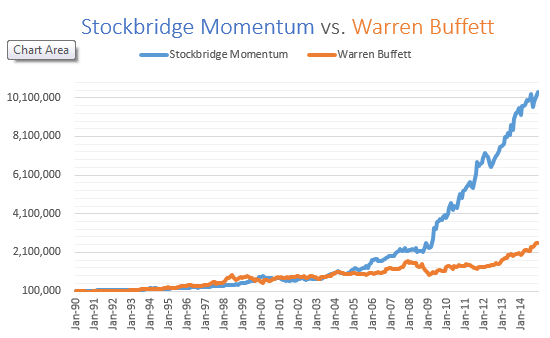
  4. Finally, once you know the risk and return metrics, does the strategy fit your goals? Does it fit your comfort level?  The reason Kahnemann won the Noble Prize in economics for doing research on behavior, is because he knew that at the end of the day, it is investor behavior that has the biggest outcome on our final wealth result, not investment performance. Do you buy at market peaks and sell at market bottoms?  Do you exit because you’re currently down 6% even though historically the strategy has been down 10%?  Those decisions will have a much larger impact on our final wealth result than anything else in the checklist.  Since 1980, even Warren Buffett has had 4 times of losses worse than 30%, and 2 of those losses were worse than 50%!  On the upside, he’s outpaced the stock market (that’s investment performance).  But how many people can sit through 30% drops, or 50% drops, especially in retirement?  That gets to the core of investor behavior. See what I mean?

If you have a portfolio of actively managed mutual funds with internal costs of 1% per year, plus a 1% management fee that’s re-balanced quarterly (like they do at companies that rhyme with “you, “es”, pank”) you have a strategy, it’s just not a very good one, unless you actually like paying high fees and can sit through 50% losses every 8 years.  Or, if you buy Disney stock because Star Wars is coming out next week, I’m sorry fellow nerdy friend, but that’s more gambling than investing.  Spend your money going to the movie instead!  You could even ask a girl to go with you!

Final point: having a pragmatic set of rules to follow for making investment decisions, that will get you closer to your unique financial goals, is where we should focus our time.  And in the final analysis, that’s all that really matters.  If you want to know “whaddya think of XYZ stock?” call Jim Cramer instead of me.  At least he’s entertaining.


Eric Ludwig is a certified financial planner in Madison, WI primarily for a select group of successful professionals and business owners, who among other things aspire to a work-optional lifestyle.  Stockbridge has developed and refined a process to put all the pieces of that puzzle together and we call it the Stockbridge GPS process.  GPS stands for Goals, Planning, Strategy.

Filed Under: Financial Planning, Momentum

Momentum Strategy Updates: November 2015

November 30, 2015 By Eric Ludwig

A Quick Update for November.  Hope you had a Happy Thanksgiving!  Time for us at Stockbridge to shake off the turkey coma and get back to business!

In our Global Momentum strategy we were in US Large Caps (VTI) and enjoyed a +0.6% return.  Turns out that was slightly better than the S&P, and only 2nd to US Small Caps for the month.  More importantly, it kept us out of Europe (-0.8%), out of Emerging Markets (-2.3%), and out of High Yield Bonds (-2.6%).

That’s why we do what we do… whereas passive strategies invest in all markets, all the time.  Does that even make sense?  Clearly there’s a better time to be in different markets, and that’s how we earn our keep.  For those of you that were my previous clients at the bank, it’s times like this that really solidify WHY we manage funds this way…it’s just a better way and you all get to enjoy those benefits.

In the bond world we utilized long-term treasuries and unfortunately lost a slight -0.34%. In Bonds, this was a month of focusing on minimizing losses (vs maximizing gains) as every bond sector was negative for the month.  Even short-term treasury bonds, which is often a proxy for money markets, even lost -0.26%.  Surely, our intention is to be cautious for December as the mid-month Fed meeting will be here before we know it.  I’ll mention what I did in the last newsletter: if you have bond funds held outside of Stockbridge, we’re happy to analyze your risk potential if interest rates rise in a few weeks.  Just let us know ahead of time and we can give guidance.  But don’t wait until it’s too late!!!!

Our Sector Rotation portion performed twice as well as the stock market, raking in 1.2% as Information Tech stocks keep rising.  Interestingly enough, of the 11 Sectors that make up the US Stock Market, 6 were negative and 5 were positive.  So it’s month’s like this where it pays to be nimble (something the big bank investors can’t do), and only invest in the rising sectors like we do. (you’re welcome). The range of sector performance were Financials performing the best at 2.1% and Utilities came in last at -2.1%.  We’ll take our earnings and move on!  Clearly there is some momentum building in the financial sector in anticipation of a Fed interest rate hike (which would likely be good for banks). Again…we’ll be watching!

My final though for the month: Time is our most precious resource. Starting with that undeniable truth, my mission is to help you get better returns with less risk so you can reach your goals faster, and less time spent thinking about the markets.  Thanks for your continued support.


Eric Ludwig is a certified financial planner in Madison, WI primarily for a select group of successful professionals and business owners, who among other things aspire to a work-optional lifestyle.  Stockbridge has developed and refined a process to put all the pieces of that puzzle together and we call it the Stockbridge GPS process.  GPS stands for Goals, Planning, Strategy.

Filed Under: Momentum, Updates

E+R=O The most important equation for investing

August 23, 2015 By Eric Ludwig

E+R=O

The most important equation for investing, and maybe even life is E + R = O.  Which stands for Event + Response = Outcome.  Meaning that the final Outcome of things that happen each day consists of some Event AND our Response to it.  We cannot control Events.  Events just happen.  We cannot cause the stock market to go up and down.  We can’t even predict whether it will go up or down.  What we can control is our Response to Events, and ultimately, it is our Response that will have the biggest impact on the end result.

For example, many years ago I had a client that was thinking about retiring soon.  When markets started to slide in 2007, I recommended that she sell some of her high-gain stocks and get into more of a balanced portfolio, but she decided to keep her portfolio the same.  In 2008, markets fell further, dropping some 40%, and she still hung-in there.  In early 2009, markets continued to drop!  Finally in early March of 2009, she said, “Eric, I can’t take it anymore.  Let’s sell everything and go to something safe.”  I’ve seen many people make this decision (response) after various market drops (events), but I will never forget this client, and this day.  It was March 9th, 2009, which was literally the absolute bottom of the market.  It hasn’t dropped a penny lower since that day.

Stocks are up about 200% from that date, but she is not.  Stocks dropping is the Event.  Her Response was to sell, literally at the worst possible time.  The final Outcome is that 8 years later she is still working, still not retired, and her account has never gotten anywhere near to its pre-crash value.  The Event (market dropping) was not the biggest factor in the final outcome (value still low), but rather it was her Response (selling low) to that Event that has had the larger, lasting impact.  She still blames the Event, when in reality it’s her Response to the event that has caused her so much grief.

 While we cannot control market Events, we can certainly control how we Respond to market movements.  What our research has found is that by analyzing market trends over the last 2 to 3 months, and owning more the markets that are going up and not owning the markets going down in that time-frame, and then repeating that process monthly, may be one of the best ways to Respond to Events.  That process generated gains during the 2008 crash.  It’s why our most conservative momentum model has made money last week while stocks dropped.  The problem with continuing to own markets that are in a down trend, is that nobody knows how far it will drop, how long it will take to bottom-out, or how long it will take to recover.  The Japanese stock market, for example, is still not above a high it set in 1989!  Sometimes, “just hang in there” is not the best advice.

We feel that most of the sell-off from last week is over concerns in China’s economy.  That is somewhat valid, as it is the 2nd largest economy in the world.  BUT, last time I checked, it is China’s economy that is bad, not ours, and we don’t have anyone invested in China.  I’m not going to sit here and tell you though, that the market will quickly reverse.  I have no way of predicting what will happen next, and neither does anybody else (not even the good looking people with expensive suits on CNBC).

Events are random.  They just happen.  Events are out of our control.  Responses are not the same as Events.  Responses can be void of emotion like fear, void of the desire to predict what will happen next, and void of having only a short-term perspective.

 Responses can consist of a rules-based strategy that has worked over decades of good and bad market cycles.  Responses can be backed by probabilities of likely outcomes.  And Responses can consider the long-term perspective.  And that’s what we do.  That’s why we’re here to help.  What I can tell you is that in one more week we will re-run our monthly analysis and continue the process of owning markets that have the highest probability for continuing up for the next month, and repeat, and repeat, and repeat.

Last week a client in my office asked, “What will happen next in the market?”  I moved my crystal ball on my desk in front of him and said, “Take a look, and you tell me.”  He said, “I don’t see anything” and I asked, “Are you sure?  Look again.”  He said, “All I see is my reflection.”

“Perfect” I said.  “That guy in the reflection, you, is ultimately what’s going to determine what really happens next.  We won’t know which way the market will move, but at least you have the wonderful ability to decide how you will respond.  And that’s the only thing that matters.”


Eric Ludwig is a certified financial planner in Madison, WI primarily for a select group of successful professionals and business owners, who among other things aspire to a work-optional lifestyle.  Stockbridge has developed and refined a process to put all the pieces of that puzzle together and we call it the Stockbridge GPS process.  GPS stands for Goals, Planning, Strategy.

Filed Under: Momentum, News, Updates

Momentum Investing Worst Months

June 15, 2015 By Eric Ludwig

Momentum Investing: Worst Months and what Happened Next

Successful Investing: Stay Disciplined

I was re-reading an awesome investing classic “What Works on Wall Street” where he discusses the simplicity and effectiveness of the “Dogs of the Dow” strategy. The author goes on to explain that there were times of the strategy’s under-performance, yet for the disciplined investor who followed the strategy through the bad times, the investor was ultimately rewarded.

In the same light, I asked:

Q: What were the 6 worst months of the Global Asset Momentum Strategy back-test? (starting in 1990)

and more importantly

Q: What happened in the following 12 months?

Below is the table with the answers:

Month-Year Month % Next 12 Months Event
May-10 -7.80% 29.90% Flash Crash
Nov-07 -7.81% 7.40% Financial Crisis
Jan-09 -8.47% 61.80% Financial Crisis
Apr-04 -8.68% 14.20% Unidentifiable
Jun-08 -8.90% -25.20% Financial Crisis
Aug-90 -12.96% 2.50% Invaded Iraq
Average:  -9.10% 15.10%

The worst 6 months range from -7.8% to the worst of -13% (averaging -9%).  The return of the strategy over the next 12 months averaged 15.1%.  They were all positive “next-12-months” except for the June 2008 to July 2009 when the strategy was still climbing itself out of the Financial Crisis.

One interesting observation: 3 of the worst 6 months occurred within 14 months of each other: November 2007…June 2008…January 2009.  That’s not to say that we wouldn’t expect poor performance to clump together again in the future, but it appears that on average, the back-test shows it’s fruitful to “stay-the-course”, even when we see a loss of -8% in one month.  This is just a repeat of what successful investors already know: invest with discipline and be rewarded.


Eric Ludwig is a certified financial planner in Madison, WI primarily for a select group of successful professionals and business owners, who among other things aspire to a work-optional lifestyle.  Stockbridge has developed and refined a process to put all the pieces of that puzzle together and we call it the Stockbridge GPS process.  GPS stands for Goals, Planning, Strategy.

The information provided on this website is meant only for general reading purposes and the views being expressed only constitute opinions and therefore cannot be considered as guidelines, recommendations or as a professional guide for the readers. Before making any investments, the readers are advised to seek independent professional advice, verify the contents in order to arrive at an informed investment decision.  Past performance is not indicative of the future performance.

Filed Under: Momentum, Updates Tagged With: Momentum Investing, Relative Strength

How To Beat Warren Buffett

June 12, 2015 By Eric Ludwig

How To Beat Warren Buffett

Beating Buffett


It’s dangerous territory to compare yourself to “the best” in anything.  But it sure makes a great benchmark.  Warren Buffett is arguably one of the best investors to walk the planet, amassing wealth to rank him one of the wealthiest people in the world.  So let’s start there.

Losers

First we’ll look at the downside of Buffett’s track record, the losses.  Since 1990 (25 years) 39% of the time he loses money in a month.  When his stock is down, how far done does it go?  The average down month is -4%, and the worst month was -14%.  Looking back, there’s been 2 times that he’s had to suffer through losses of 50% (2001, and 2008). (Could you image being down $40 billion?!)  So even the “best investor” has certainly had his down times.

Digging deeper we find that when there’s a losing month, 56 times it’s just a single down month-in-a-row, but he’s suffered through 5 consecutive losing months twice, and even had a really bad streak of 7 losing months-in-a-row at one point (in 2004).

Losing Month Comparison

How does our Global Asset Momentum strategy compare?  It’s experiences a losing month 32% of the time (vs 39%).  When it goes down, the average loss is -3% (vs -4%), and it’s worst month is -13% (vs -14%).  So our strategy has been slightly better in each category.  But there’s one very big improvement: the maximum loss has only been -22% which is significantly easier to handle than Buffett’s 50% losses twice.  I think it’s fair to say that our strategy has done a better job of experiencing less losses, and far less dramatic losses than Buffett.

Growth

But losses are just one side of the coin.  The bottom line is “who’s grown more?”  In the last 25 years, Buffett has outpaced the stock market, earning a compound annual return of 14%.  $100,000 invested with Buffet (re-investing dividends) grows to a healthy $2.6 million in 25 years.

The Stockbridge Momentum Strategy beats Buffett.

It’s averaged 20% per year since 1990, and the same $100,000 invested grows to an astonishing $10.4 million.  Now we can see the impact of earning just a few percentage points more per year, and doing just a little bit better job of minimizing risk.  It’s literally a 400% difference over 25 years.


Here’s the data tables:

%losing months avg loss worst month MDD
Stockbridge Momentum 32% -3% -13% -22%
Berkshire 39% -4% -14% -44%


%up months avg gain best month Growth
Stockbridge Momentum 68% 4% 21% 20%
Berkshire 59% 4% 30% 14%


Source: Yahoo Finance

Eric Ludwig is a certified financial planner in Madison, WI primarily for a select group of successful professionals and business owners, who among other things aspire to a work-optional lifestyle.  Stockbridge has developed and refined a process to put all the pieces of that puzzle together and we call it the Stockbridge GPS process.  GPS stands for Goals, Planning, Strategy.

The information provided on this website is meant only for general reading purposes and the views being expressed only constitute opinions and therefore cannot be considered as guidelines, recommendations or as a professional guide for the readers. Before making any investments, the readers are advised to seek independent professional advice, verify the contents in order to arrive at an informed investment decision.  Past performance is not indicative of the future performance.

Filed Under: Momentum Tagged With: momentum, Relative Strength

Momentum Investing vs. the Traditional “Old” Way

June 1, 2015 By Eric Ludwig

Filed Under: Financial Planning, Momentum, Updates, Video Tagged With: Beat the Market, Dual Momentum, Less Risk, Momentum Investing, Protect from Crashes, Relative Strength

Primary Sidebar

Reach Out

We’ll call you, talk about your financial goals, and help you decide if we’re a good fit.  Yeah, it’s that easy.

Ready to Learn More?

Footer

Corporate Headquarters

2180 Baptisia Pass, WI
Sun Prairie, WI 53590

Email

Email us by clicking here

Office Number

(920) 287-3010

Copyright © 2025 StockbridgeWealth.com

  • Who We Are
  • What We Do
  • Recent News