• Skip to primary navigation
  • Skip to main content
  • Skip to primary sidebar
  • Skip to footer
Stockbridge Private Wealth Management

Stockbridge Private Wealth Management

Personalized Financial Strategies for a Secure Retirement

  • Home
  • About
    • About Us
    • Why Hire Us
    • Contact Us
  • The Retirement Specialist Book
  • Services
    • Investment Management
    • Retirement Planning
    • Retirement Income
    • Tax Planning
    • Social Security Timing
    • Insurance Optimization
  • Insights
  • Contact Us
  • Schwab Account Login

Eric Ludwig

How To Beat Warren Buffett

June 12, 2015 By Eric Ludwig

How To Beat Warren Buffett

Beating Buffett


It’s dangerous territory to compare yourself to “the best” in anything.  But it sure makes a great benchmark.  Warren Buffett is arguably one of the best investors to walk the planet, amassing wealth to rank him one of the wealthiest people in the world.  So let’s start there.

Losers

First we’ll look at the downside of Buffett’s track record, the losses.  Since 1990 (25 years) 39% of the time he loses money in a month.  When his stock is down, how far done does it go?  The average down month is -4%, and the worst month was -14%.  Looking back, there’s been 2 times that he’s had to suffer through losses of 50% (2001, and 2008). (Could you image being down $40 billion?!)  So even the “best investor” has certainly had his down times.

Digging deeper we find that when there’s a losing month, 56 times it’s just a single down month-in-a-row, but he’s suffered through 5 consecutive losing months twice, and even had a really bad streak of 7 losing months-in-a-row at one point (in 2004).

Losing Month Comparison

How does our Global Asset Momentum strategy compare?  It’s experiences a losing month 32% of the time (vs 39%).  When it goes down, the average loss is -3% (vs -4%), and it’s worst month is -13% (vs -14%).  So our strategy has been slightly better in each category.  But there’s one very big improvement: the maximum loss has only been -22% which is significantly easier to handle than Buffett’s 50% losses twice.  I think it’s fair to say that our strategy has done a better job of experiencing less losses, and far less dramatic losses than Buffett.

Growth

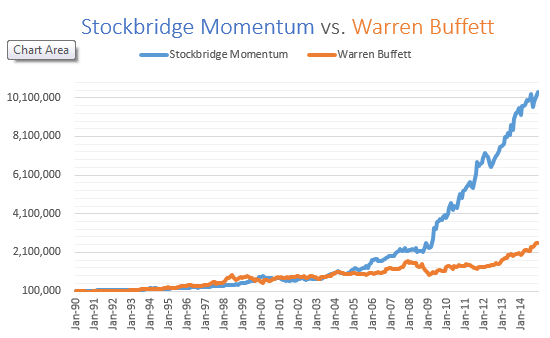
But losses are just one side of the coin.  The bottom line is “who’s grown more?”  In the last 25 years, Buffett has outpaced the stock market, earning a compound annual return of 14%.  $100,000 invested with Buffet (re-investing dividends) grows to a healthy $2.6 million in 25 years.

The Stockbridge Momentum Strategy beats Buffett.

It’s averaged 20% per year since 1990, and the same $100,000 invested grows to an astonishing $10.4 million.  Now we can see the impact of earning just a few percentage points more per year, and doing just a little bit better job of minimizing risk.  It’s literally a 400% difference over 25 years.


Here’s the data tables:

%losing months avg loss worst month MDD
Stockbridge Momentum 32% -3% -13% -22%
Berkshire 39% -4% -14% -44%


%up months avg gain best month Growth
Stockbridge Momentum 68% 4% 21% 20%
Berkshire 59% 4% 30% 14%


Source: Yahoo Finance

Eric Ludwig is a certified financial planner in Madison, WI primarily for a select group of successful professionals and business owners, who among other things aspire to a work-optional lifestyle.  Stockbridge has developed and refined a process to put all the pieces of that puzzle together and we call it the Stockbridge GPS process.  GPS stands for Goals, Planning, Strategy.

The information provided on this website is meant only for general reading purposes and the views being expressed only constitute opinions and therefore cannot be considered as guidelines, recommendations or as a professional guide for the readers. Before making any investments, the readers are advised to seek independent professional advice, verify the contents in order to arrive at an informed investment decision.  Past performance is not indicative of the future performance.

Filed Under: Momentum Tagged With: momentum, Relative Strength

Buy your Advisor 5 Lamborghini’s

June 11, 2015 By Eric Ludwig

Let’s say you’ve done well in life.  You did what you were supposed to do: you saved all your life, invested, and accumulated $1 million.  You’re ready to retire and looking to hire a Financial Advisor to help manage your investments and keep you on track with your financial plans throughout life.

Advisor Fee: 1%

You call around and find that the average Financial Advisor charges 1% per year (National Average, PriceMetrix.com).  Many people believe that is the only cost.  There are additional costs for the investments.

Mutual Fund: 1.25%

According to Morningstar, the average mutual fund charges 1.25% a year.  I have yet to see a firm show this charge being deducted on a statement, but make no mistake, if you own a mutual fund there is a fee being deducted by the fund manager (called the expense ratio).

Total Cost: 2.25%

So using the average cost of an Advisor and a Mutual Fund, you’re “all-in” at 2.25% per year.

How to Reduce Costs:

ETF Cost Reduction: 1%

Let’s say your Advisor uses low cost index funds, ETF’s (Exchange Traded Funds) instead of Mutual Funds.  The average cost of ETF’s that we use at Stockbridge charge a 0.11%, a full 1.14% less than the average Mutual Fund.  So what does this amount to in cost savings over 25 years, and a 7% return?

$1 MILLION!

Actually it’s $1,066,235 LESS in FEES.  $1 million grows to $3.2MM using the average fees (1% Advisor, 1.25% mutual fund), but grows to $4.3MM simply by reducing costs.

Control the Controllable

While we can’t control the market, we can control fees.  The effect of reducing costs could be $1 million for every $1 million you have invested.  OR, you could simply buy 5 Lamborghini’s and drop them off in your Financial Advisor’s parking lot for them.  It’s up to you.

Filed Under: Financial Planning

Momentum Investing vs. the Traditional “Old” Way

June 1, 2015 By Eric Ludwig

Filed Under: Financial Planning, Momentum, Updates, Video Tagged With: Beat the Market, Dual Momentum, Less Risk, Momentum Investing, Protect from Crashes, Relative Strength

New Website Launch today!

April 23, 2015 By Eric Ludwig

Exciting stuff for us here at Stockbridge, as we launched our brand-new website today.  It’s the exact same domain name (stockbridgewealth.com) but we’ve completely updated the site to give it a fresh new look and added some cool new features.

Now we have features like this (the blog) where I can answer frequently asked questions, give market updates, and talk about our most recent research.

We’ve also listed more info about strategies, and added a feature to download the most recent performance sheets.

Pretty soon we’ll be adding a tool to compare your fees ONLINE for free!  Even better, you’ll be able to compare your exact portfolio to one that matches your risk tolerance, and then shows you backtested comparisons as well as future fee savings.  Neat stuff!  So check back again soon.

Filed Under: Updates

  • « Go to Previous Page
  • Page 1
  • Interim pages omitted …
  • Page 3
  • Page 4
  • Page 5

Primary Sidebar

Reach Out

We’ll call you, talk about your financial goals, and help you decide if we’re a good fit.  Yeah, it’s that easy.

Ready to Learn More?

Please enable JavaScript in your browser to complete this form.
Name *

Footer

Corporate Headquarters

2180 Baptisia Pass, WI
Sun Prairie, WI 53590

Email

Email us by clicking here

Office Number

(920) 287-3010

Copyright © 2026 StockbridgeWealth.com

  • Who We Are
  • What We Do
  • Recent News